Bring parking, permits, inspections, evidence and reporting into one practical council workflow.
Rosters can drift from demand
Static patrol plans may not match when parking pressure, non-compliance or customer impact actually occurs.
Aero Ranger helps teams understand when enforcement demand, patrol activity, infringements, occupancy and workload patterns change across hours, days and operating periods.
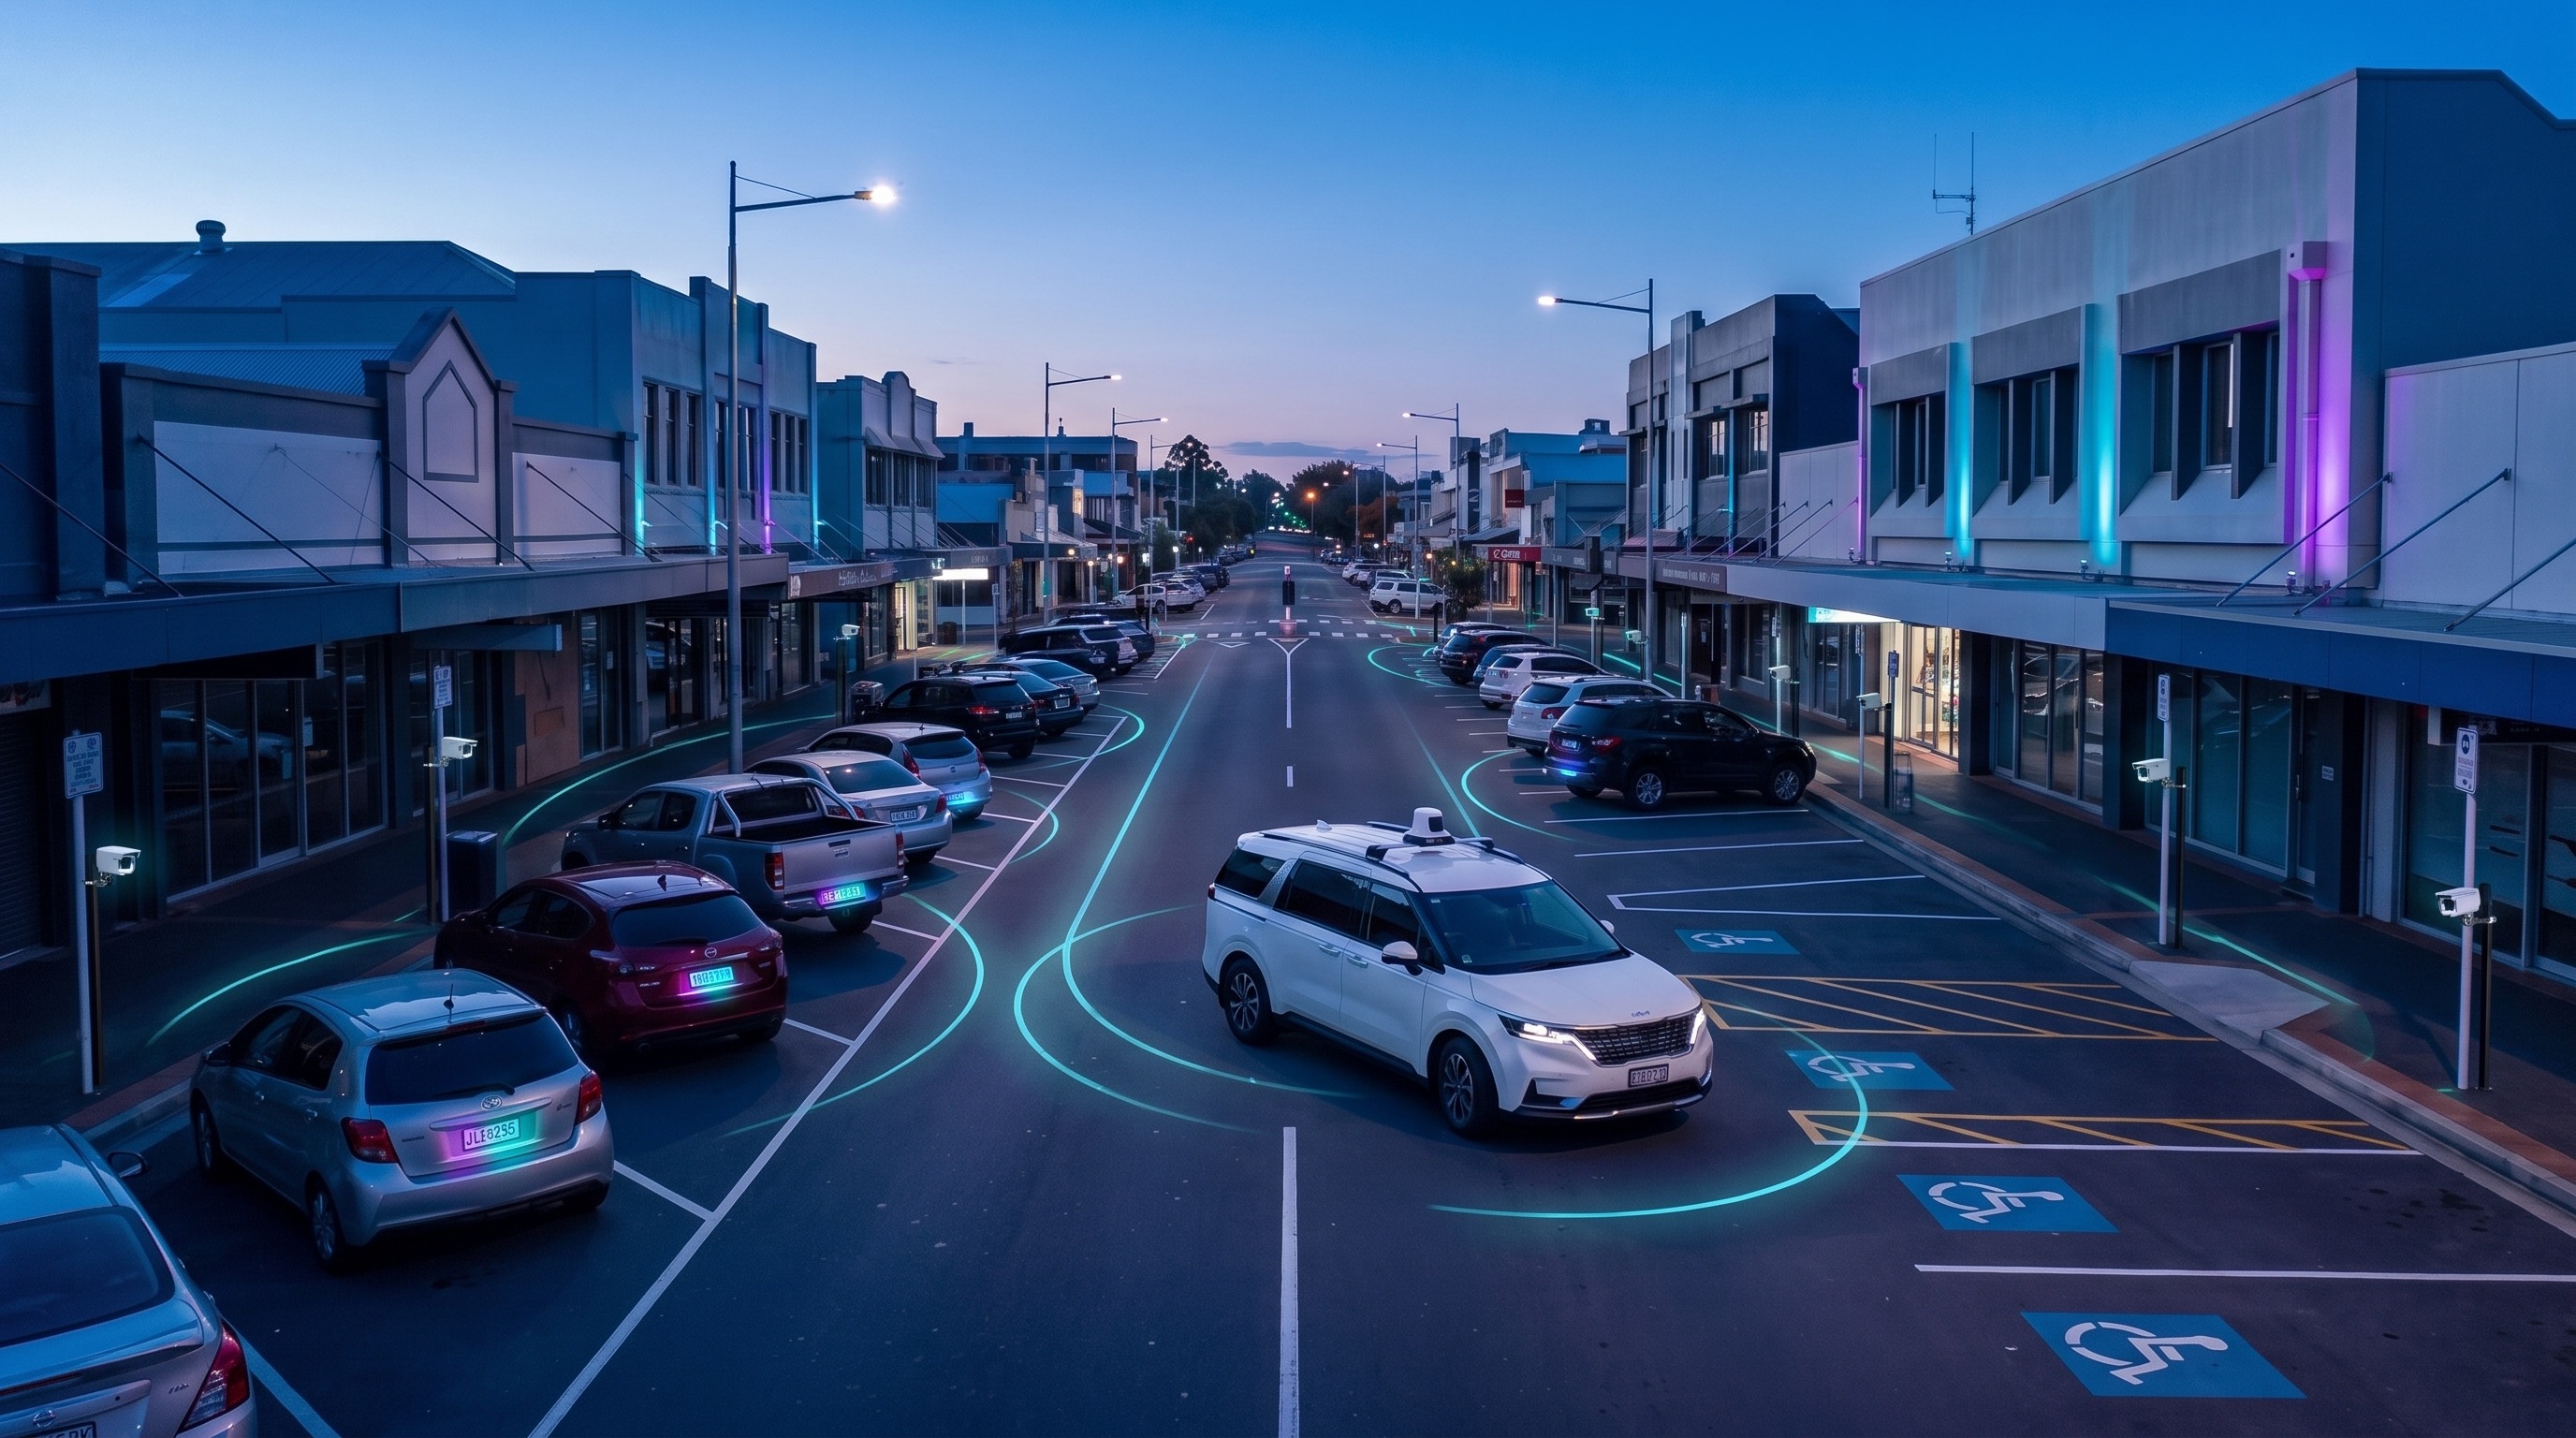
Aero Ranger helps teams understand when enforcement demand, patrol activity, infringements, occupancy and workload patterns change across hours, days and operating periods.
The busiest hour can disappear inside a daily average. Look closer.
Changing demand. Different operating windows. Patrol rosters. Outcomes that need to be compared fairly.
AeroRanger connects time analysis. Frame the question. Segment activity. Compare demand and output. Review the operating plan. Report the evidence.
Bring together zone schedules, officer activity and survey observations across the selected hours and days. Keep the source context behind each comparison.
Back in CORE, explore peaks, coverage and recorded outcomes across the periods that matter to your team.
Use consistent exports to support roster discussions, patrol planning and a clear explanation of proposed changes.
Bring a patrol timing question. We'll show the workflow. AeroRanger. Book your time-analysis demo.
Teams need to see patterns across mornings, afternoons, evenings, weekdays, weekends, events and seasonal periods so coverage follows real demand.
Static patrol plans may not match when parking pressure, non-compliance or customer impact actually occurs.
Daily totals can hide short peaks, quiet periods, event surges and weekend differences.
Clearways, loading zones, school zones, permit zones and short-stay areas often have different rules by time.
Changes to staffing, patrol windows or enforcement focus need evidence that explains the timing decision.
The field app / iPhone and Android
Keep tasks, cases and field observations connected through the shift. Use those records alongside the wider analysis of workload and timing in CORE.
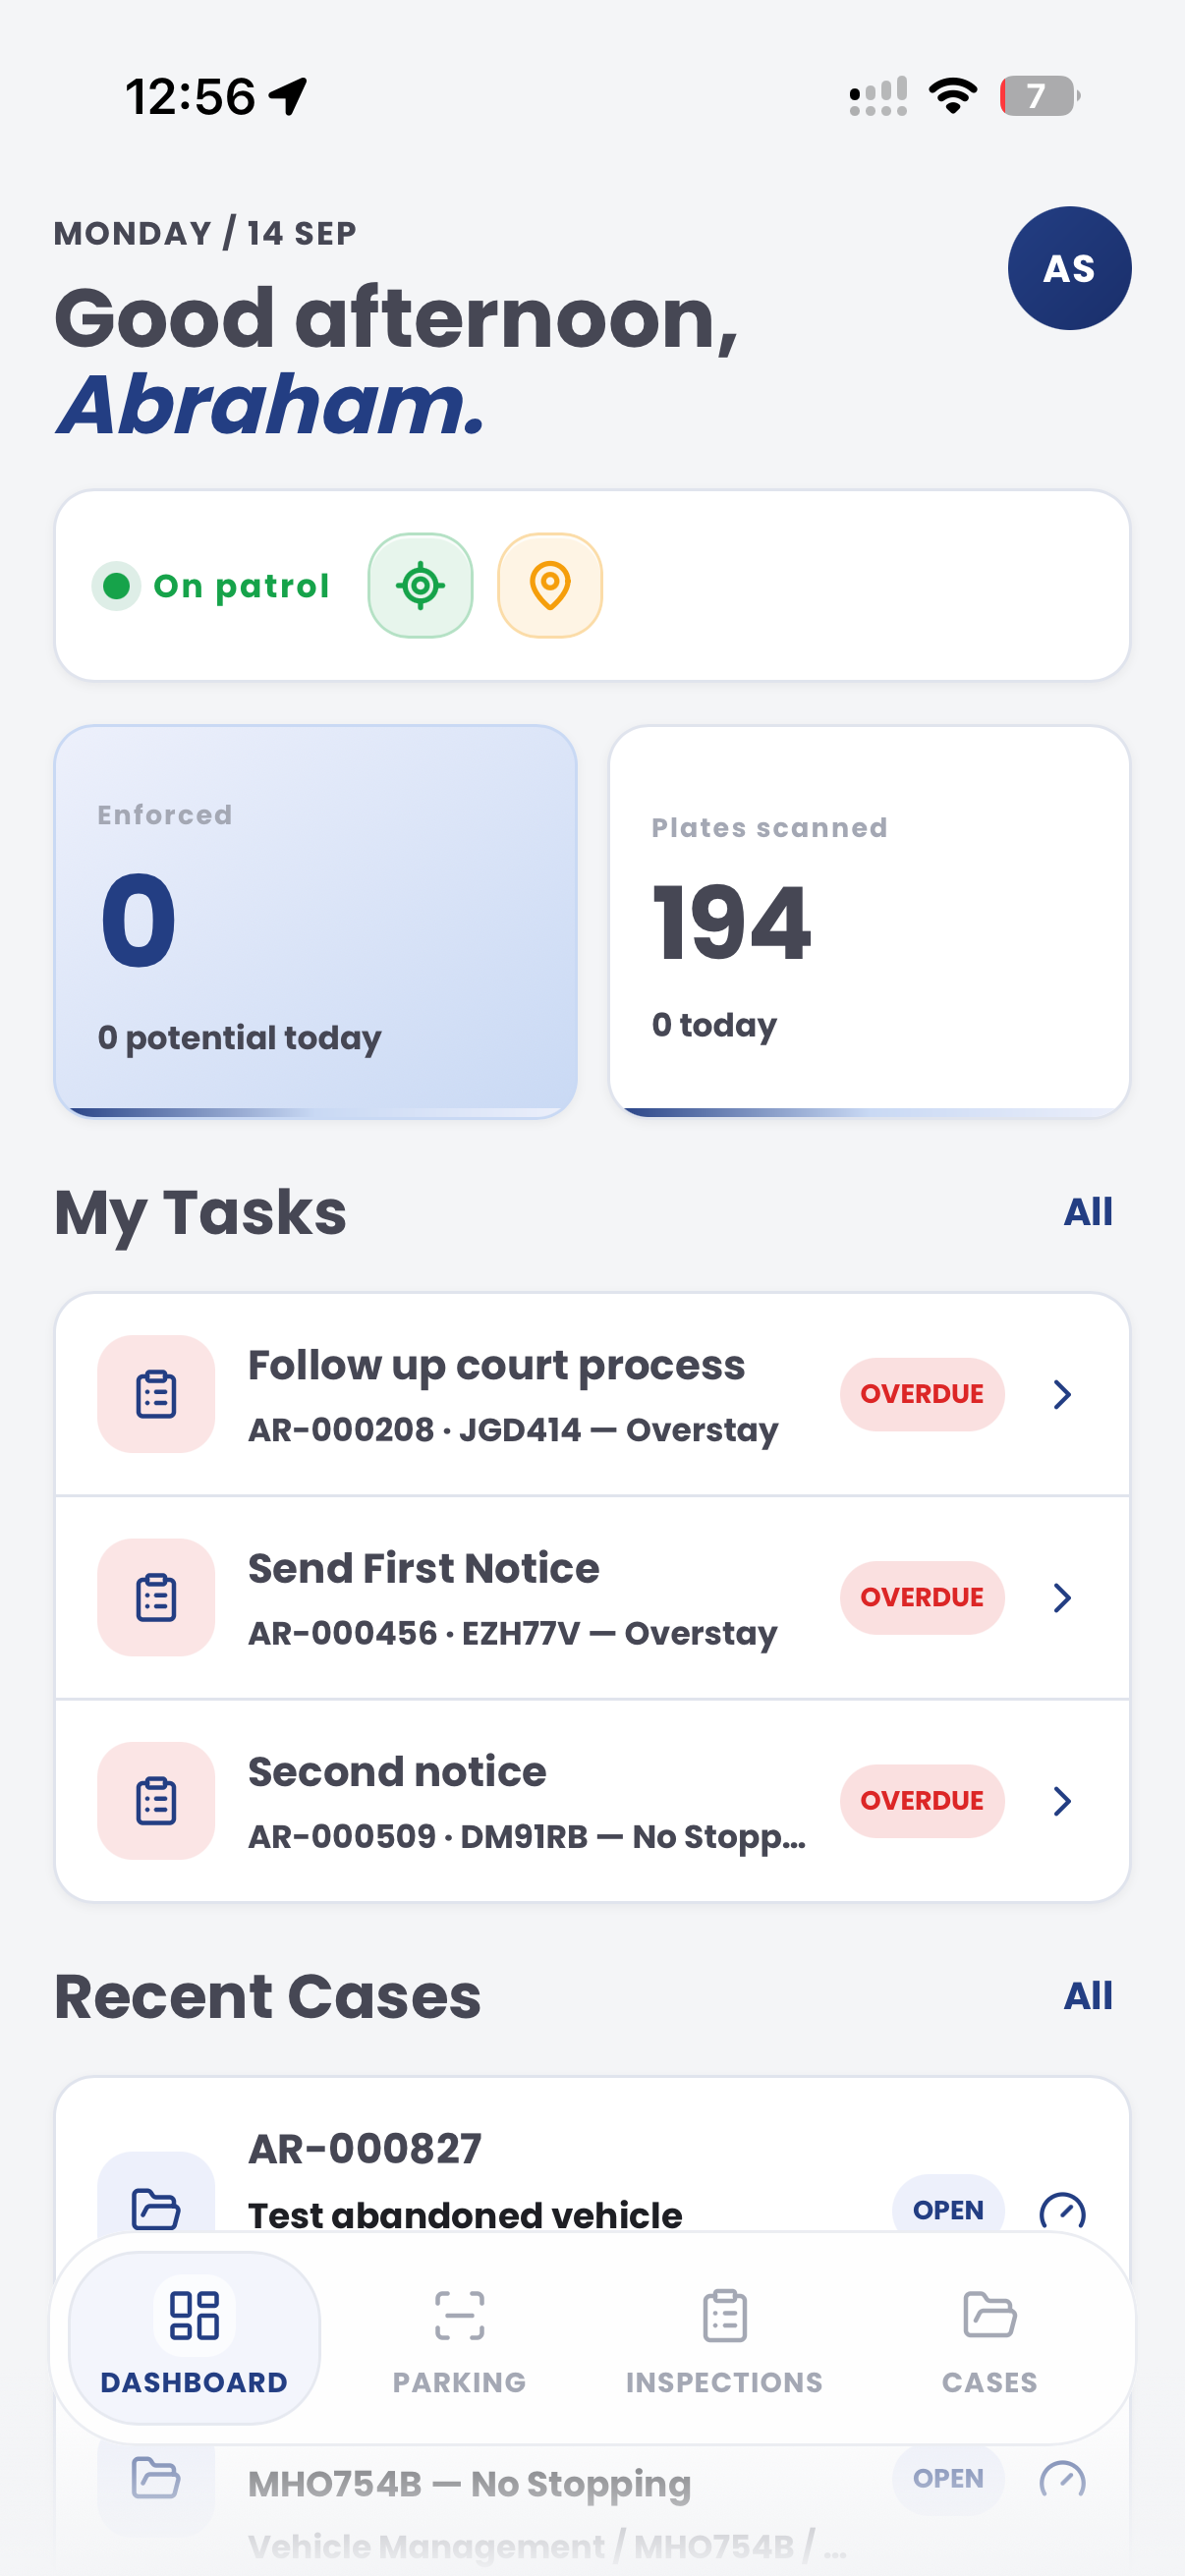
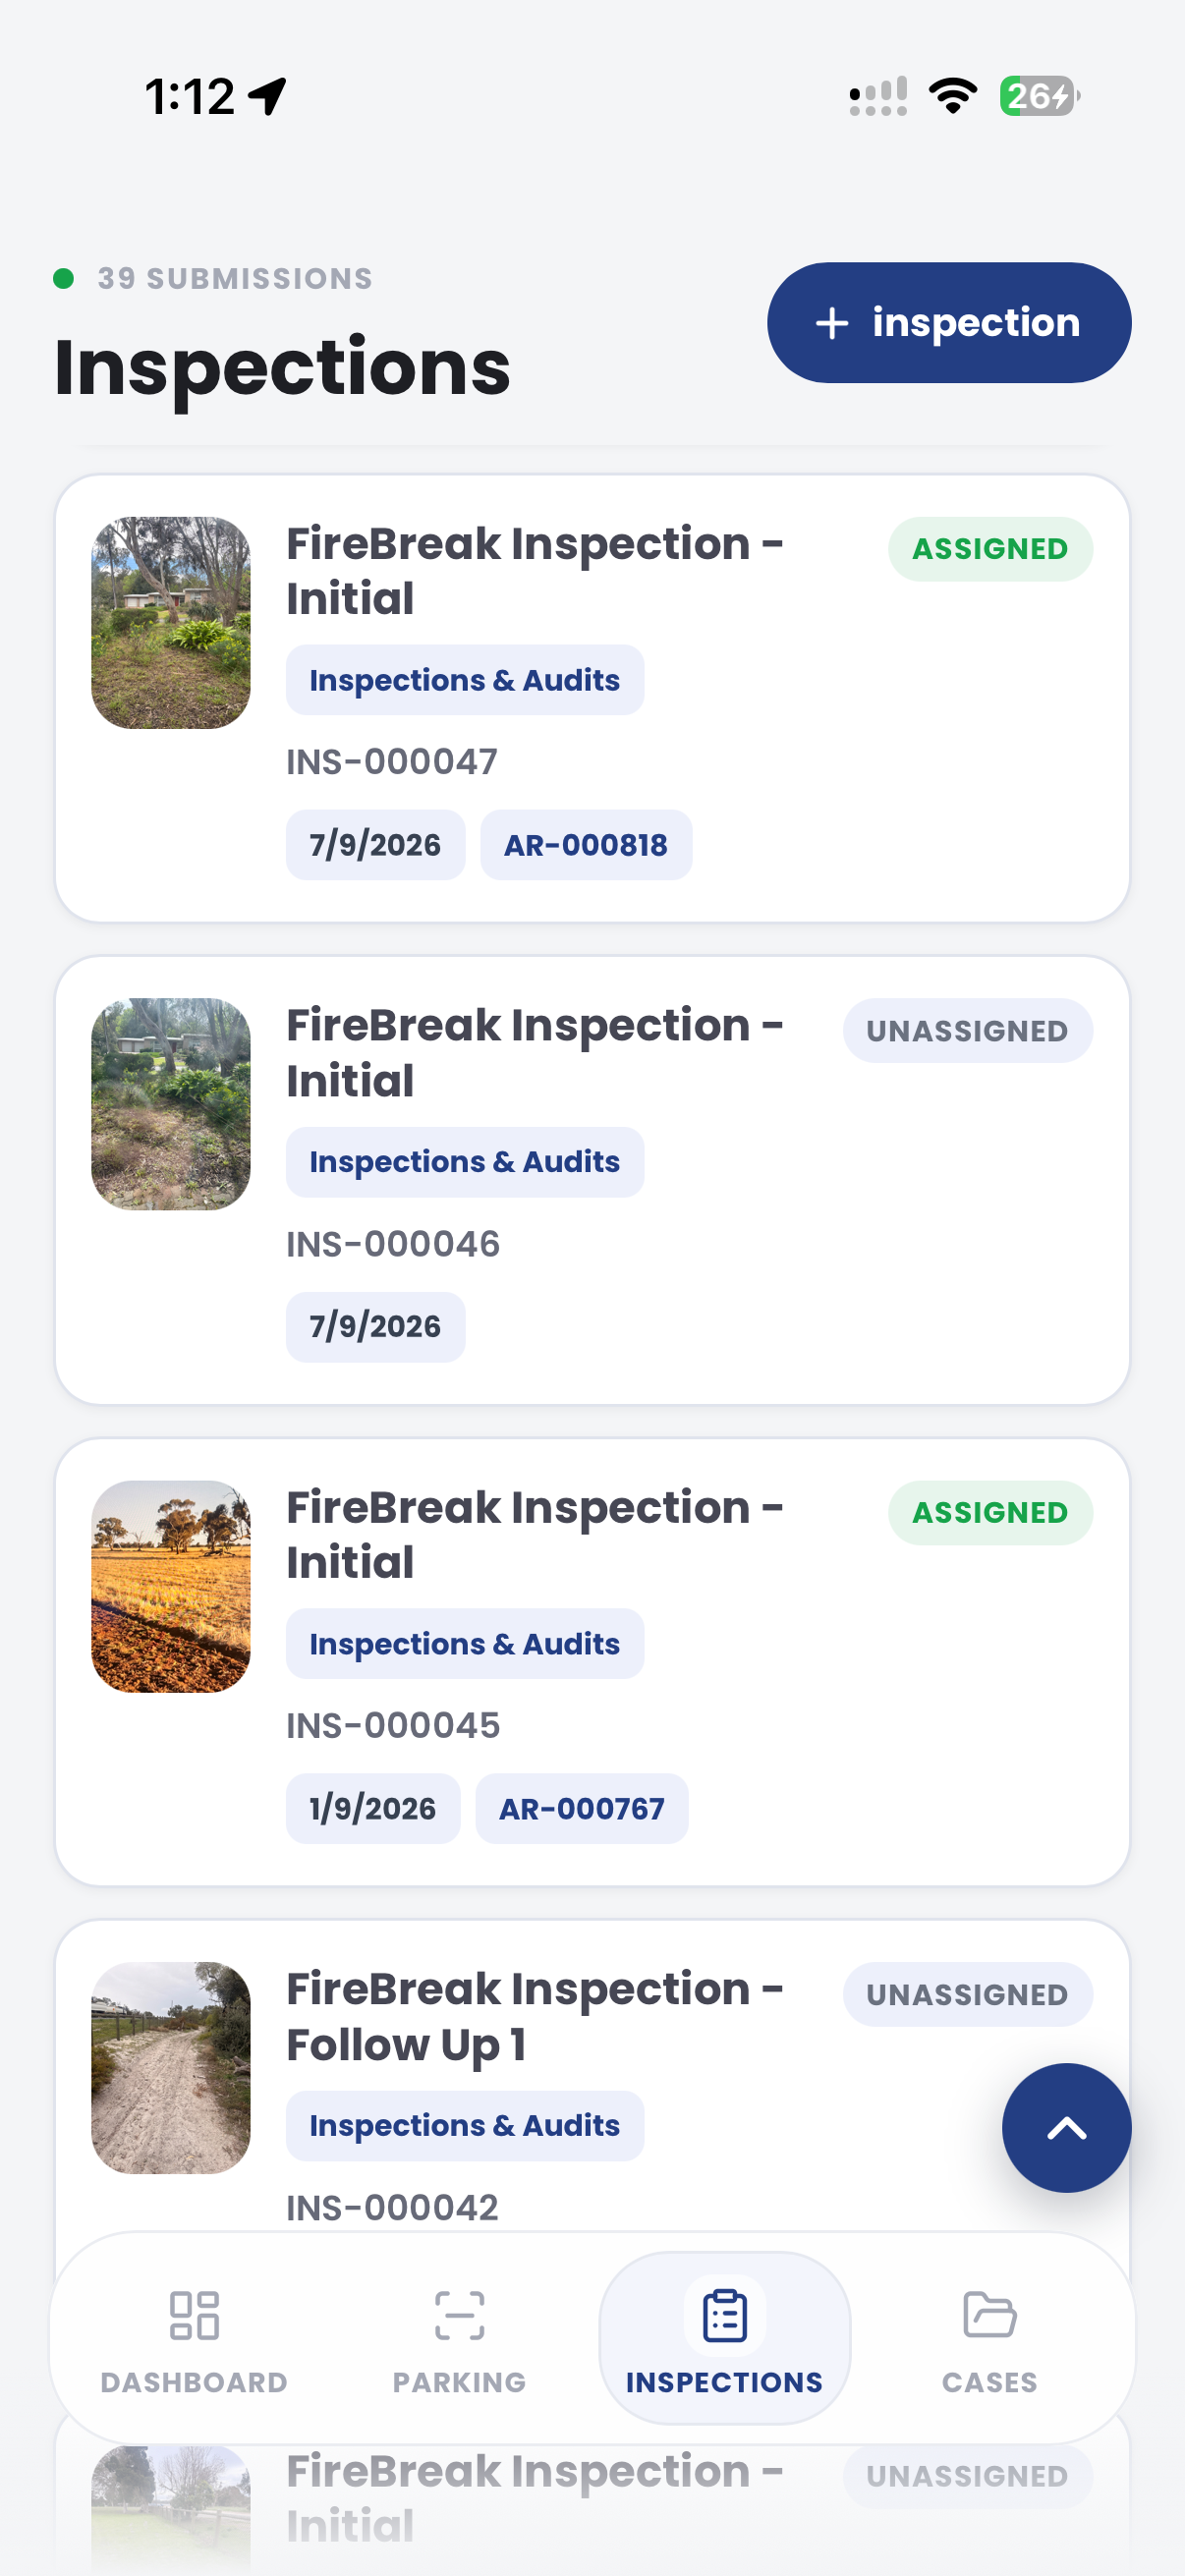
The useful question is not which feature exists. It is whether the team can see the place, rule, evidence, exception, next action and review history before making a decision.
Review activity and outcomes by time of day, day of week and selected operating periods.
Intel time analysis, filters, trend views and exports.Compare timing patterns against zone schedules, active hours, clearways and school-zone rules.
Zones, schedules, active hours, rule profiles and parking overview.Understand when officers are active, what areas they cover and what outputs occur in each period.
Intel officers, active days, officer workload and case ownership.Use occupancy, dwell and turnover surveys to explain when demand is highest.
Surveys dashboard, vehicle replay, generate report and zone analytics.Compare scans, infringements, value, cases and follow-up by time segment.
Intel returns, cases, unpaid follow-up and exports.Export time-pattern evidence for patrol planning, roster review and leadership reporting.
Create exports, saved reports and generated reporting packs.Time analysis needs the hour, day, zone, officer, vehicle and outcome connected before a roster or patrol plan can be improved.
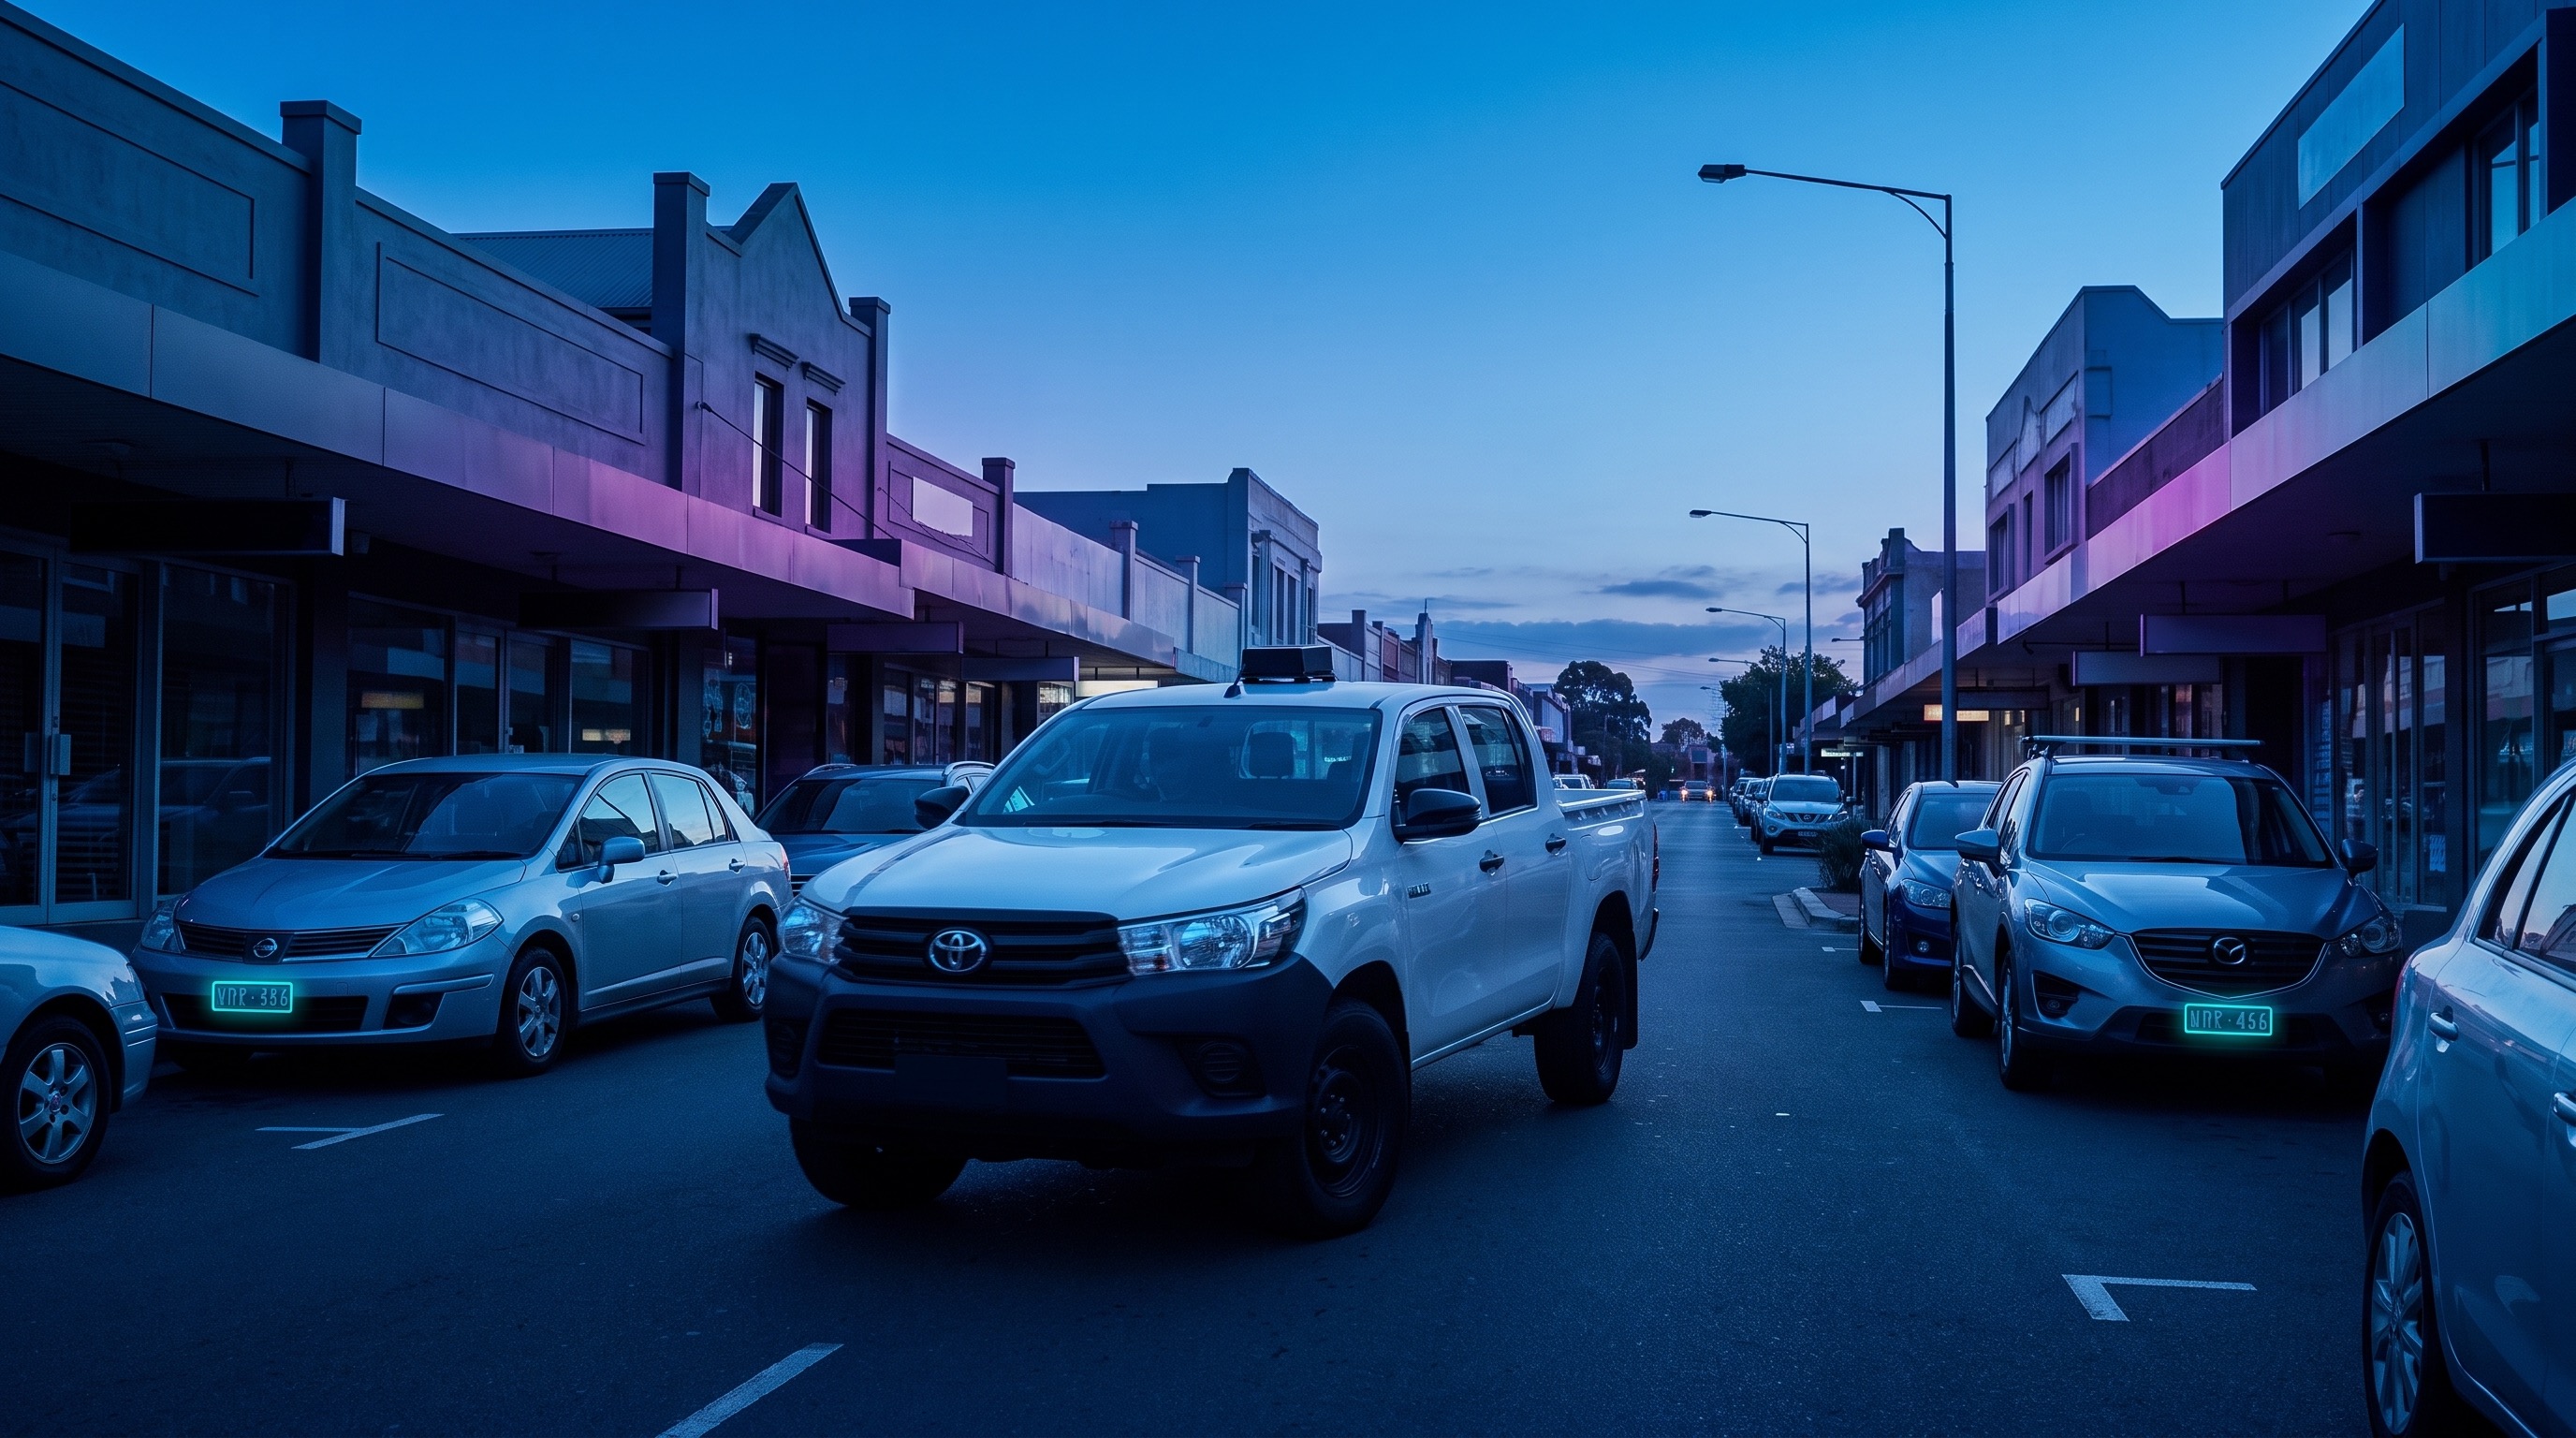
Segment activity by hour, day, operating window, event period or season.
Compare patrol output against occupancy, dwell, turnover and complaint patterns.
Review scans, infringements, cases, value and follow-up by time period.
A time-analysis report compares demand, patrol activity, cases and outcomes across hours and days.
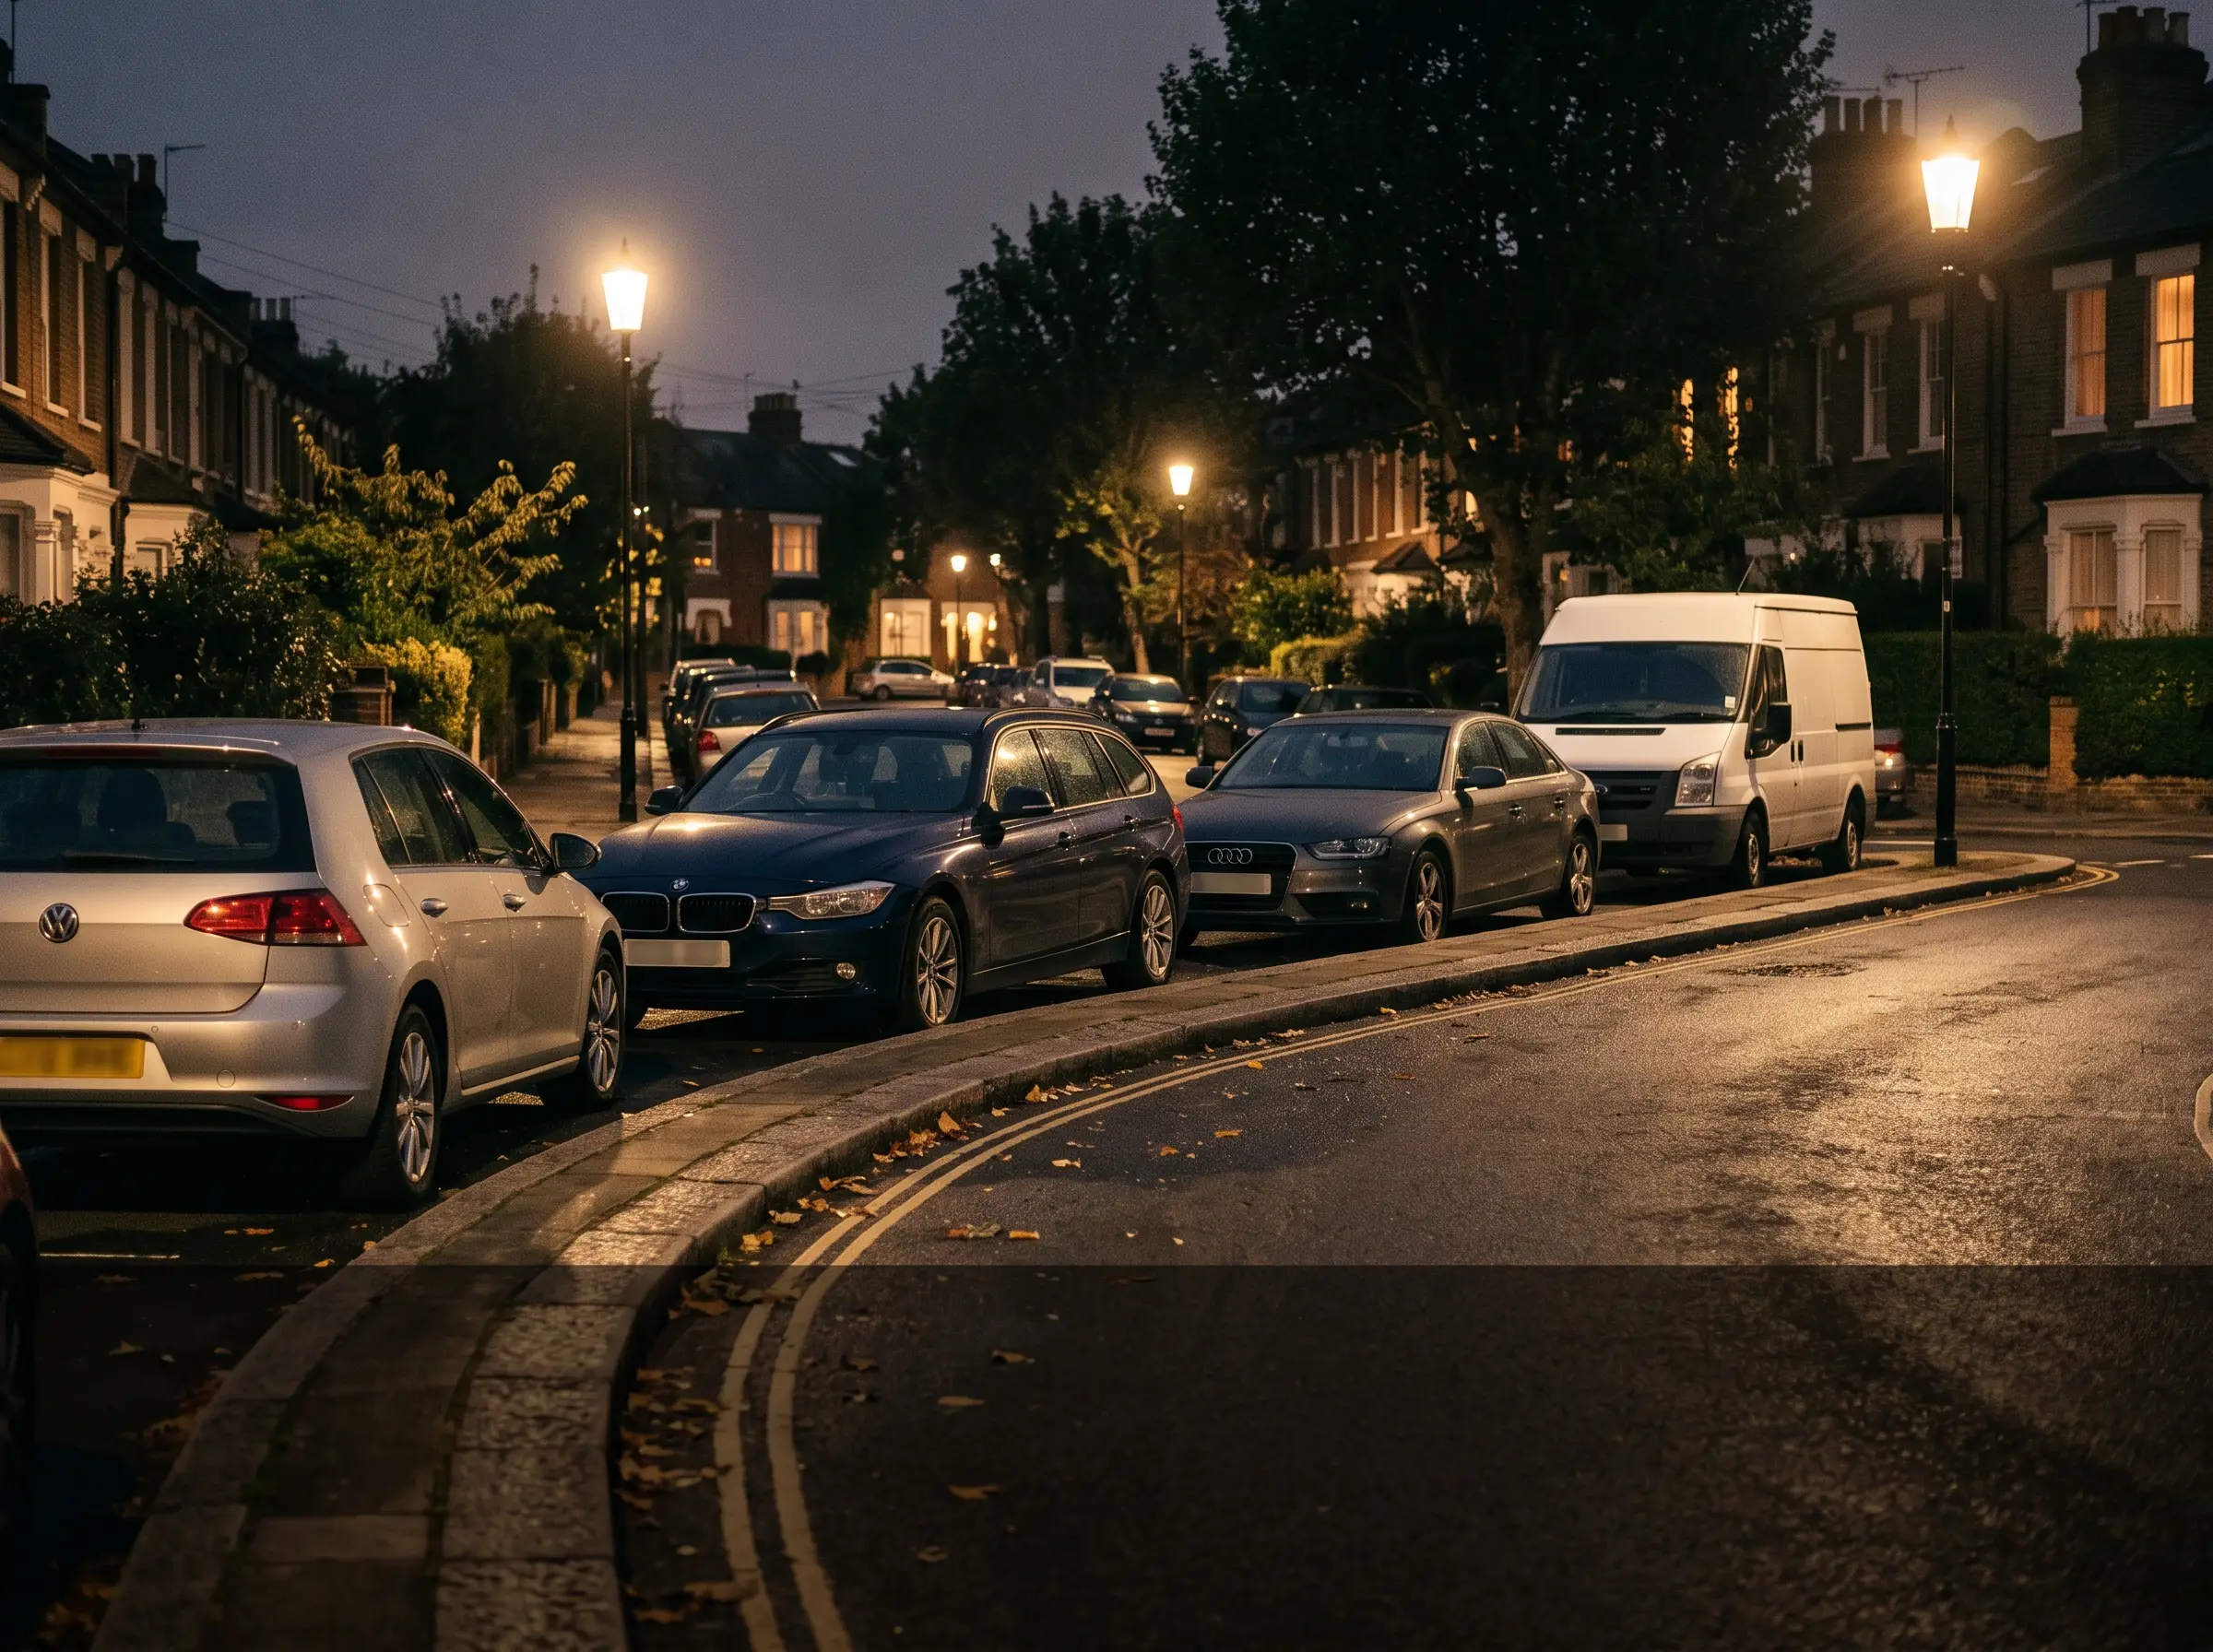
Compare active restriction times with patrol and outcome data
Aero Ranger keeps the issue photos, place context, rule context and follow-up state together so the case can be checked later without rebuilding the record.
The issue photo stays on TIME-AN-31 with the case note and current case status.
Site, street, reserve, bay, kerbside or zone context stays attached so reviewers can see where the issue occurred.
The relevant signage, permit condition, local-law category or operating rule is recorded beside the issue evidence.
Later photos, reinspection notes, notice evidence and closure decisions remain in the same case trail.
Time analysis helps councils ask whether field effort matches demand. The workflow compares when issues occur with when officers patrol, what they find and what outcomes follow.
Choose the period, such as school peaks, weekends, evenings, events, paid-parking hours, seasonal demand or complaint windows.
Review occupancy, complaints, scans, inspections, warnings, notices, case workload, officer activity and exception notes by time period.
Use the evidence to shift patrol timing, change routes, plan campaigns, brief managers or support policy and signage review.
Hour, day, week, season, school period, event period, paid parking window or local rule window.
Occupancy, dwell, complaints, hotspot activity, repeat vehicles, permit pressure and local-law demand.
Patrol coverage, scans, inspections, warnings, notices, cases opened, cases closed and staff workload.
Weather, events, device outage, roster gap, signage changes, temporary restrictions and manual notes.
Peak pressure, quiet periods, shift alignment, enforcement mix, trend charts and management recommendations.
Start with a time question, segment the data, compare demand and output, then update patrol plans or reporting.
Choose the hour, day, zone, event or operating period you need to understand.
Filter scans, surveys, officer activity, infringements and cases by time period.
Review utilisation, patrol coverage, value and outcomes by time segment.
Use the findings to tune patrol windows, rosters, event coverage or zone rules.
Export time-pattern evidence for managers, executives and operational planning.
Once activity is segmented by time, the same workflow supports ROI, zone utilisation, events and staff reporting.
Use time analysis to understand when zones are full, empty or under pressure.
Find the time periods where effort produces the strongest operational return.
Compare temporary event demand and enforcement output across event periods.
Review scheduled school-zone windows, activity and outcomes.
Share the short brochure with stakeholders, then use the procurement guide to frame requirements, governance, rollout and evaluation.
Bring a patrol timing question and we will show time-of-day, day-of-week, zone, officer, value and export views.
Technology procurement guide
Use your organisation or government email address. Your guide will be ready to open as soon as the form is submitted.

